TL;DR
To keep myself honest:
- Metrics: Prometheus scrapes Proxmox, Home Assistant, node-exporter, and cAdvisor.
- Logs: Grafana Alloy ships Docker container logs into Loki.
- Traces: Tempo is standing by for OTLP, waiting for me to finally instrument something.
- UI: Grafana is the “single screen” where it all becomes legible.
The Problem: My Homelab Was Talking… Just Not to Me
One evening I did the classic homelab ritual: “just a quick update.”
Ten minutes later, I was staring at a frozen UI, a loud fan, and a dashboard that basically said: good luck, detective.
The homelab wasn’t broken… it was just silent in all the wrong ways. I had pieces of information scattered everywhere:
- a little CPU graph here
- a random container log there
- a vague feeling that Proxmox was judging me
What I wanted was a single place where I could answer three questions quickly:
- What is happening? (metrics)
- Who did it? (logs)
- Why did it happen? (traces… eventually)
So I gave my homelab the gift of being understandable.
The Architecture (in human words)
Think of this upgrade as three storylines that meet in Grafana:
Metrics pipeline
First, I taught Prometheus to “listen” to the important characters:
- Proxmox (via
pve-exporter) - Home Assistant (
/api/prometheus) - node-exporter on each host (CPU/RAM/disk/network)
- cAdvisor on each host (containers)
Once Prometheus could scrape everything, Grafana stopped being a blank canvas and started feeling like a control room.
Proxmox metrics (from “black box” to visibility)
The first win was turning Proxmox into something I could scan.
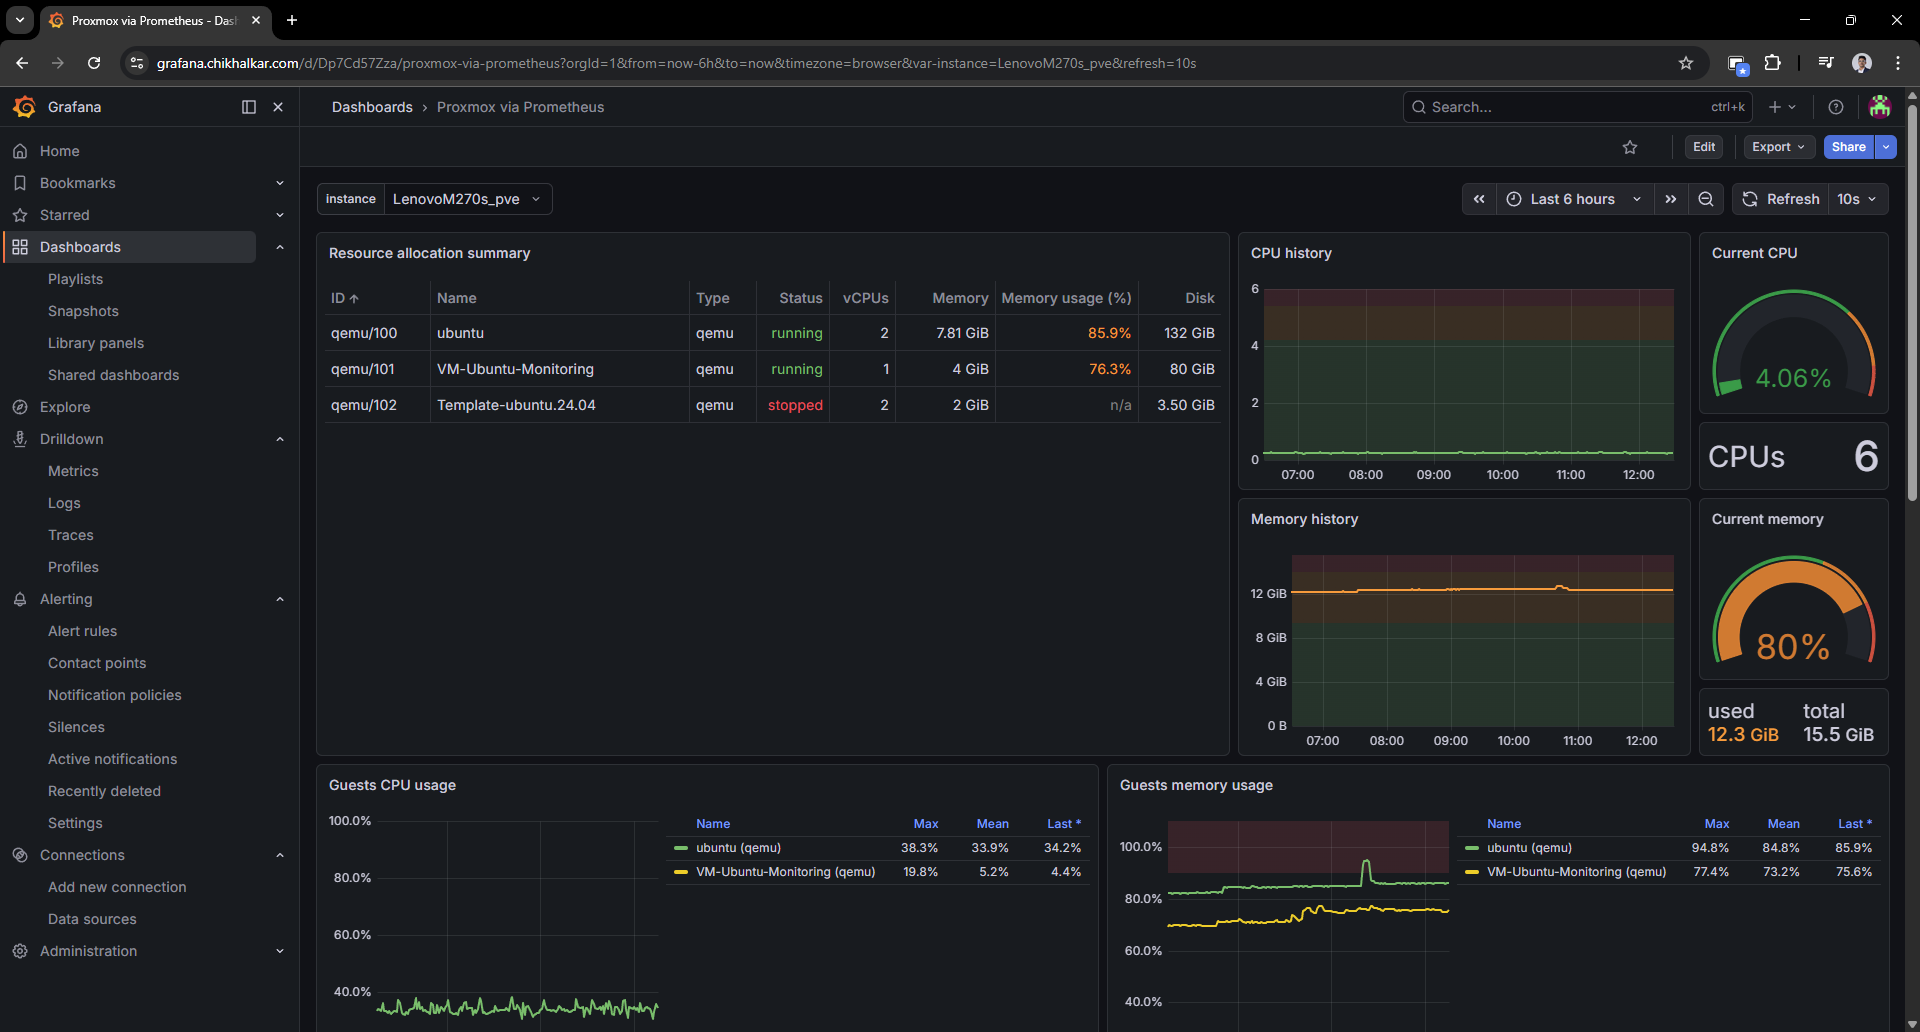 Caption: A VM list that tells me who’s running, who’s stopped, and who’s pretending to behave.
It’s weirdly comforting to see guest CPU/memory/disk and know exactly which VM is “that one.”
Host metrics (node-exporter)
Next: node-exporter. This is the dashboard that answers “is the machine healthy?” in two seconds.
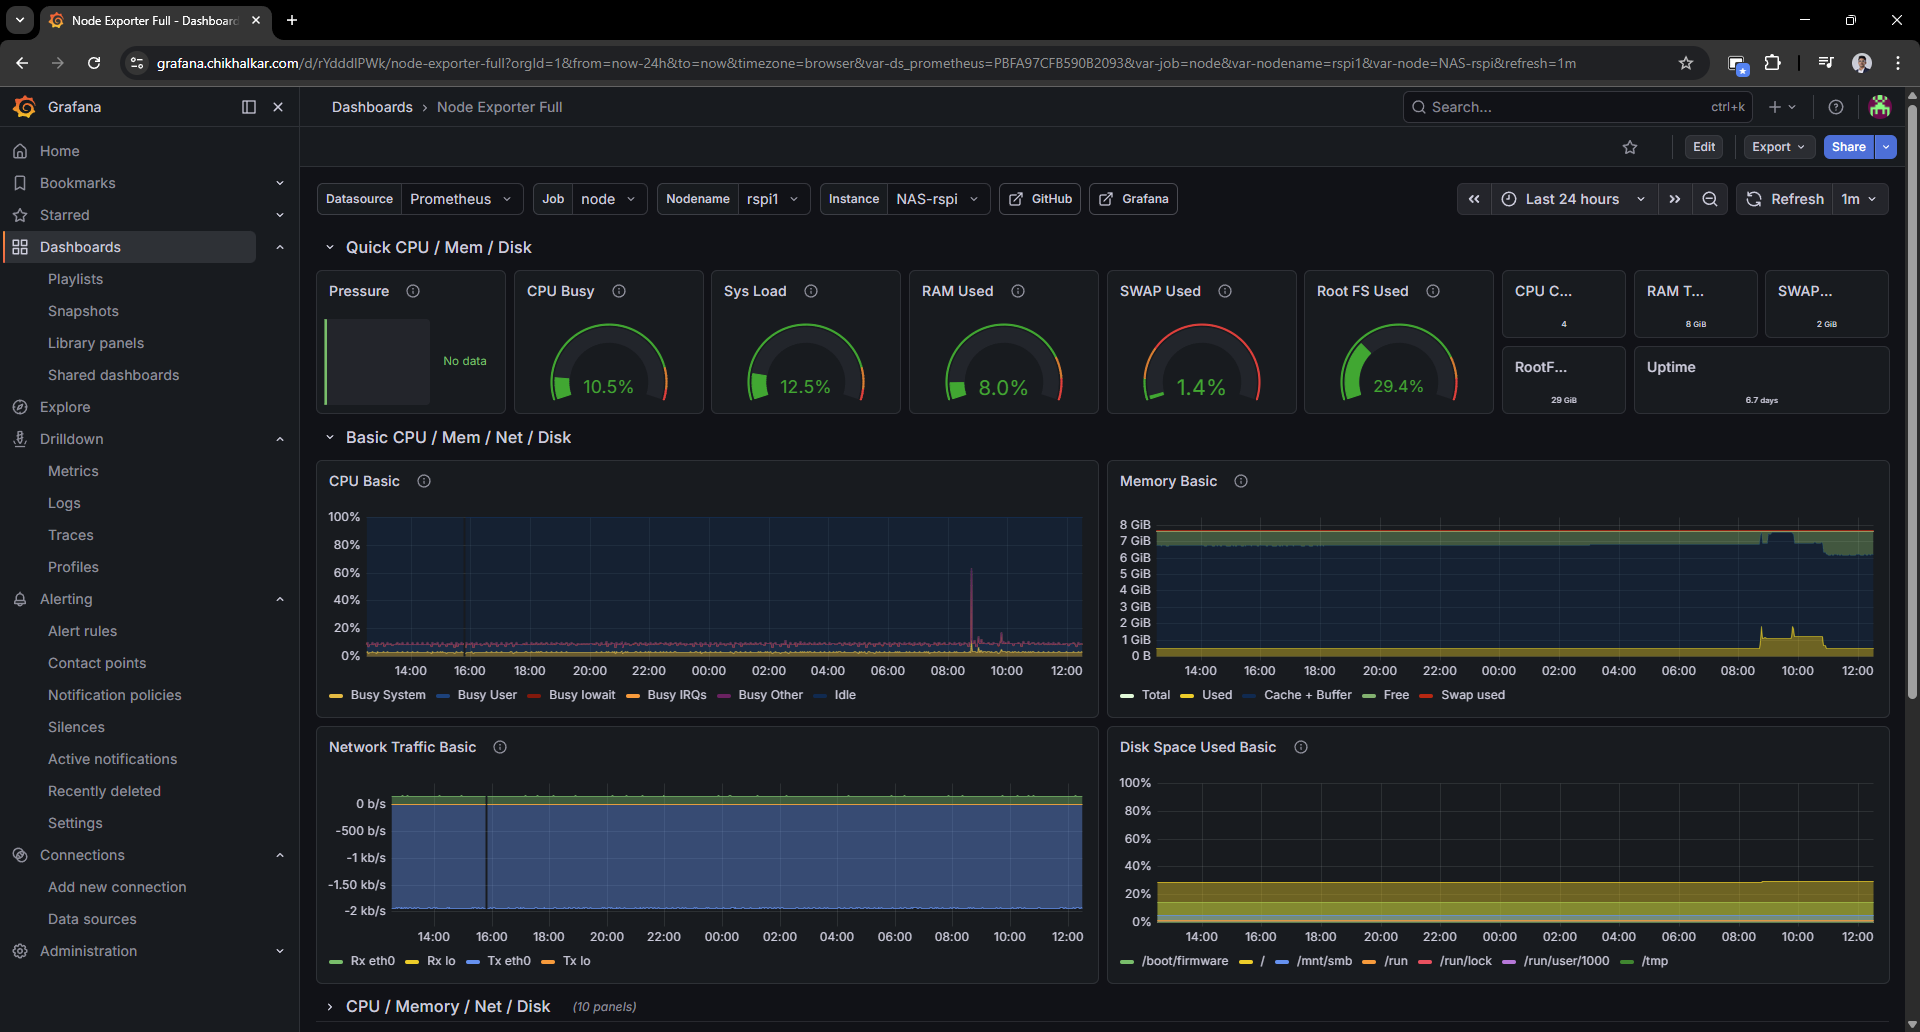 Caption: CPU/RAM/disk graphs that let me say “that spike was definitely you” with confidence.
Once you have this, you stop guessing and start diagnosing.
Container metrics (cAdvisor)
Host metrics are great, but containers are where the chaos lives. cAdvisor gives each container a profile and a paper trail.
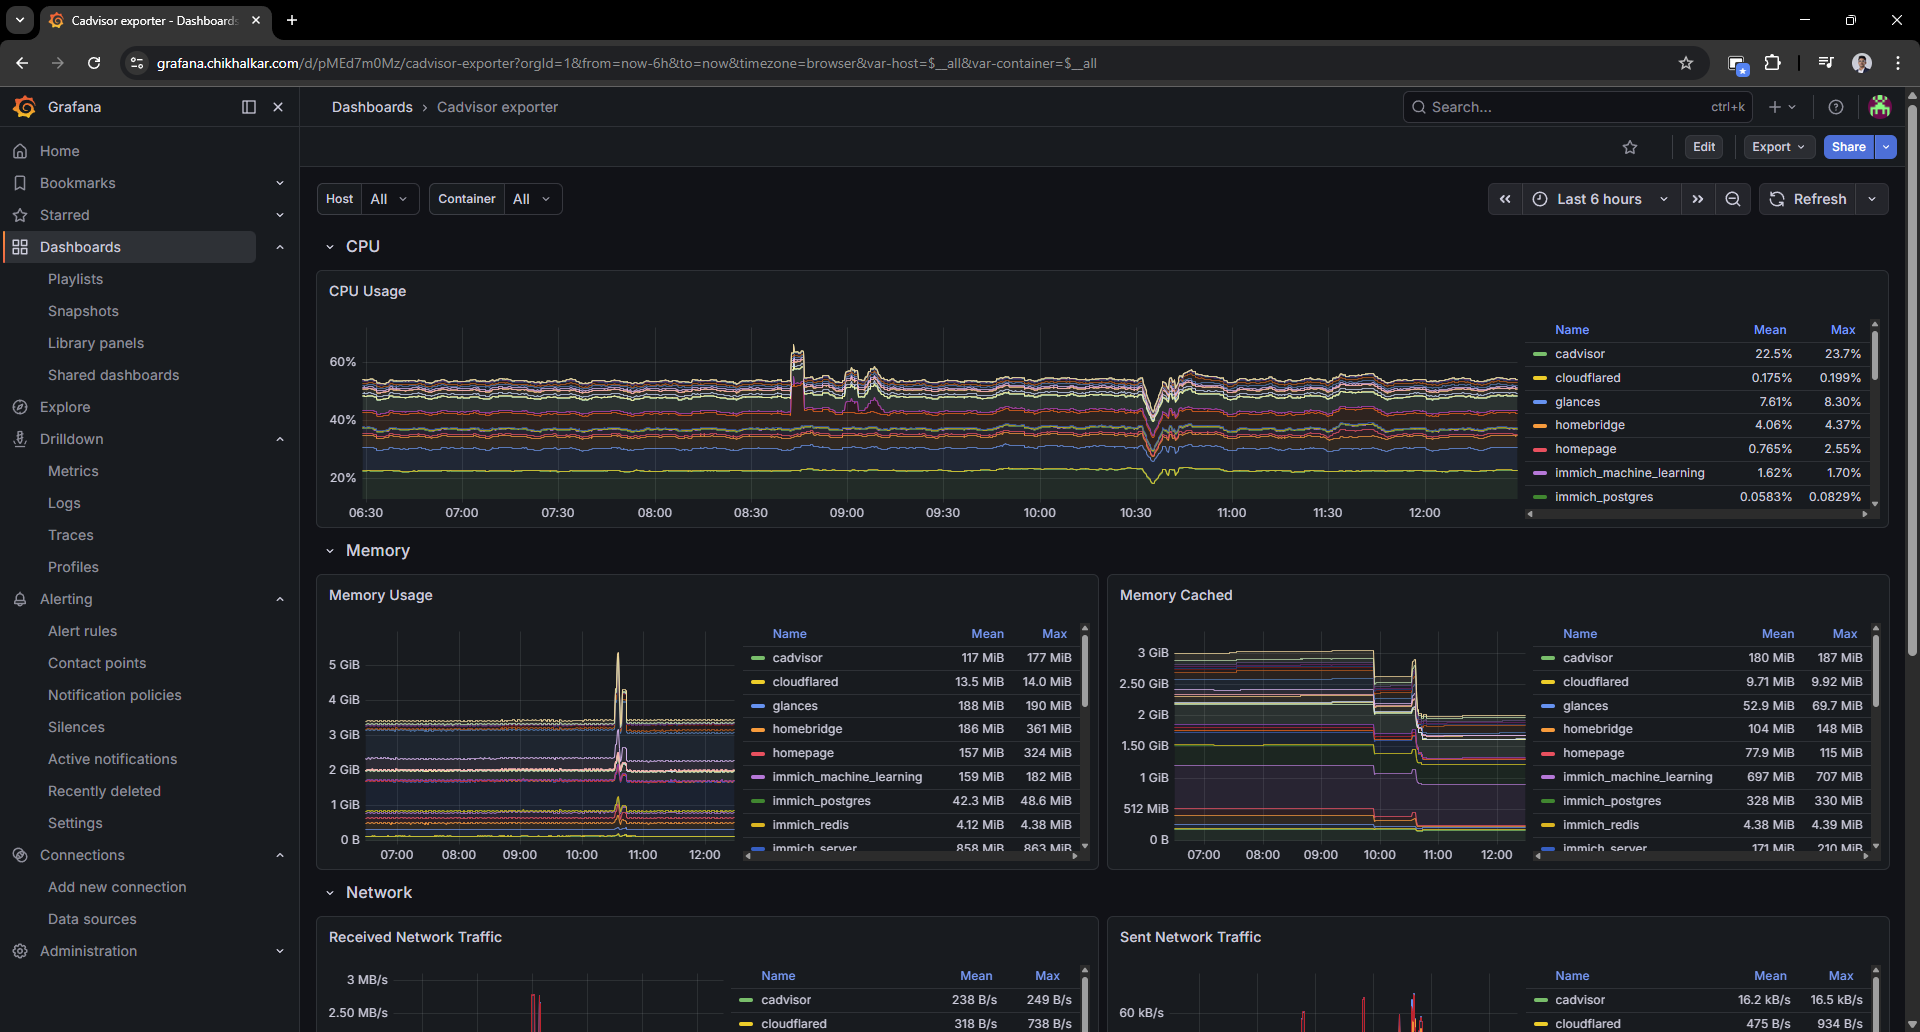 Caption: When containers start acting up, this is where I go to point fingers… politely.
This is the moment the homelab started feeling “operable” instead of “mystical.”
Logs pipeline
Metrics are great, but they don’t tell you who did the crime.
So I added Alloy to scoop up Docker logs and ship them into Loki — with labels that make filtering painless.
In practice, Grafana Alloy is the log collection agent: it discovers containers via the Docker socket, attaches consistent labels (for example compose_service, container, stream), and forwards the log stream to Loki. The end result is that “find the error for this service” becomes a fast query instead of a guessing game.
Logs in Grafana (Loki + Alloy)
This is where Loki + Alloy pay rent. Once the logs land in Loki with labels, Grafana drilldowns become the fastest path from “weird behavior” to “ah, that line again.”
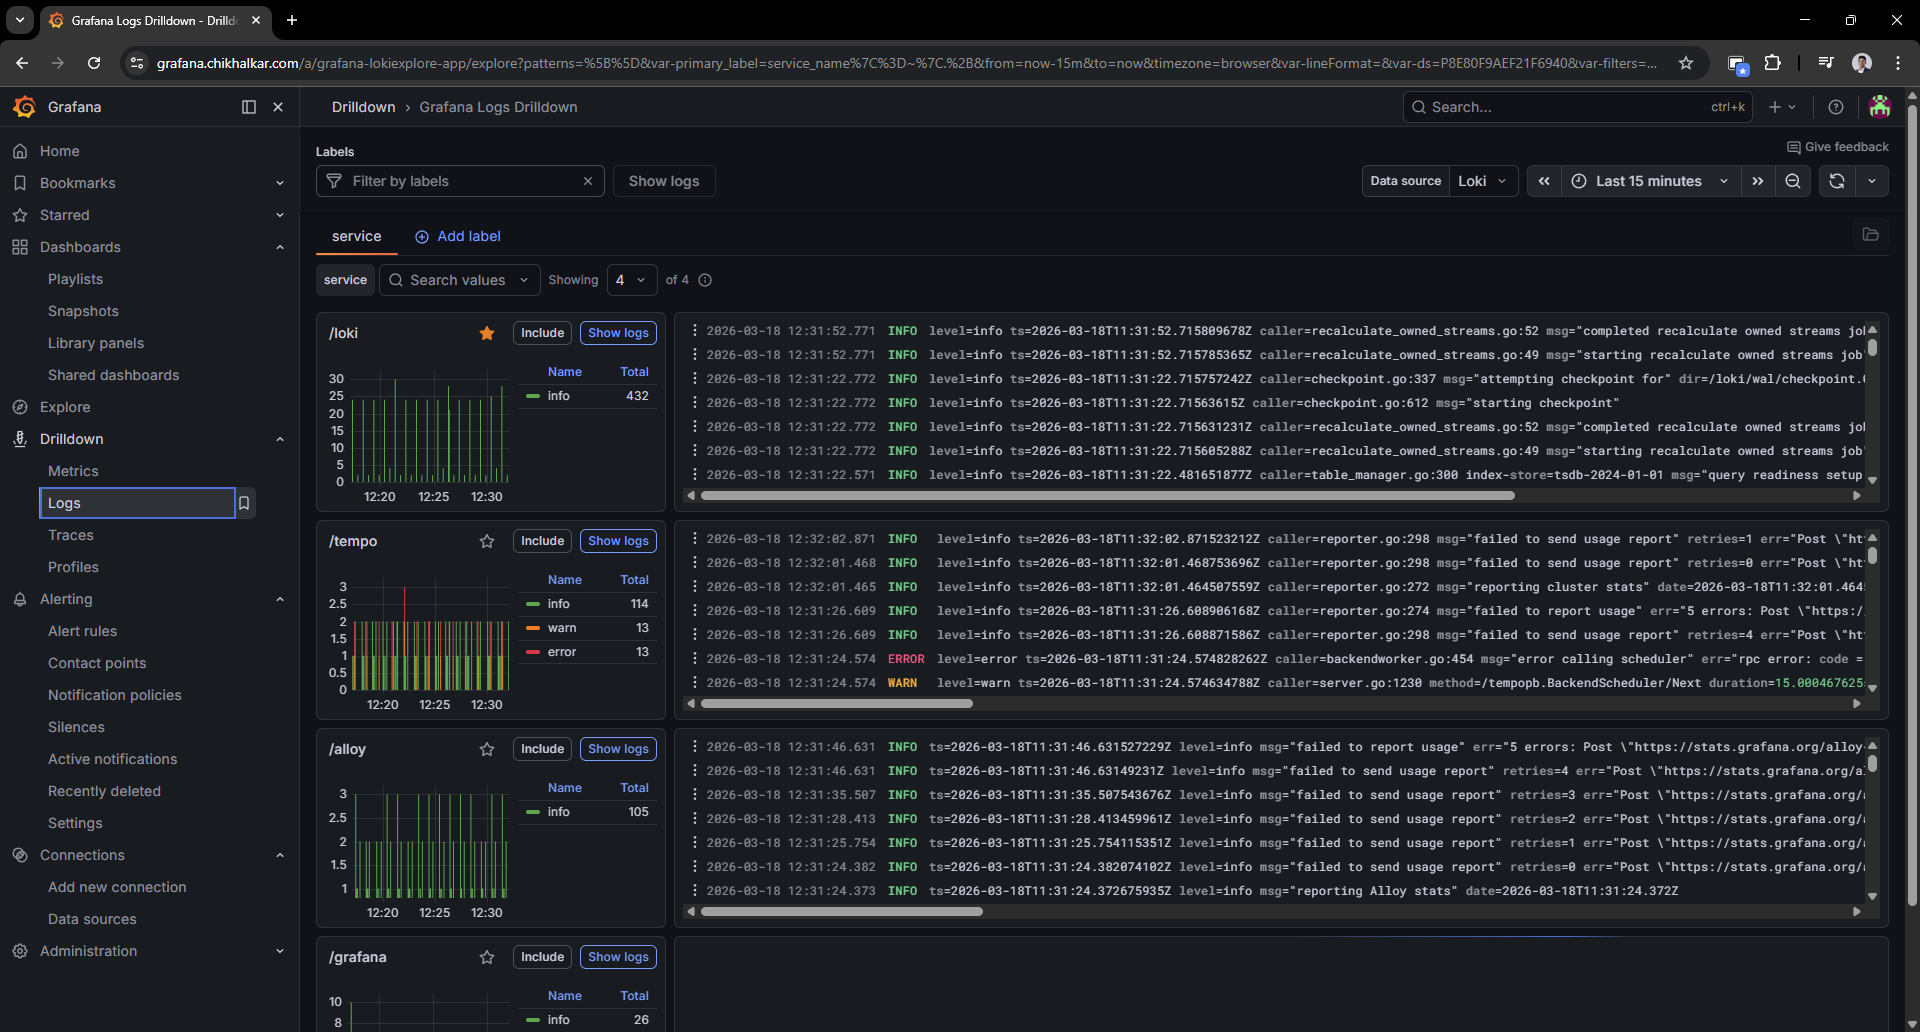 Caption: Logs, but searchable and structured — like giving
 docker logs a college degree.
Filtering by compose_service or container name feels like cheating (the good kind).
Ad-hoc metric exploration
Sometimes I don’t want a dashboard — I want to rummage around in the metrics like a raccoon with a flashlight.
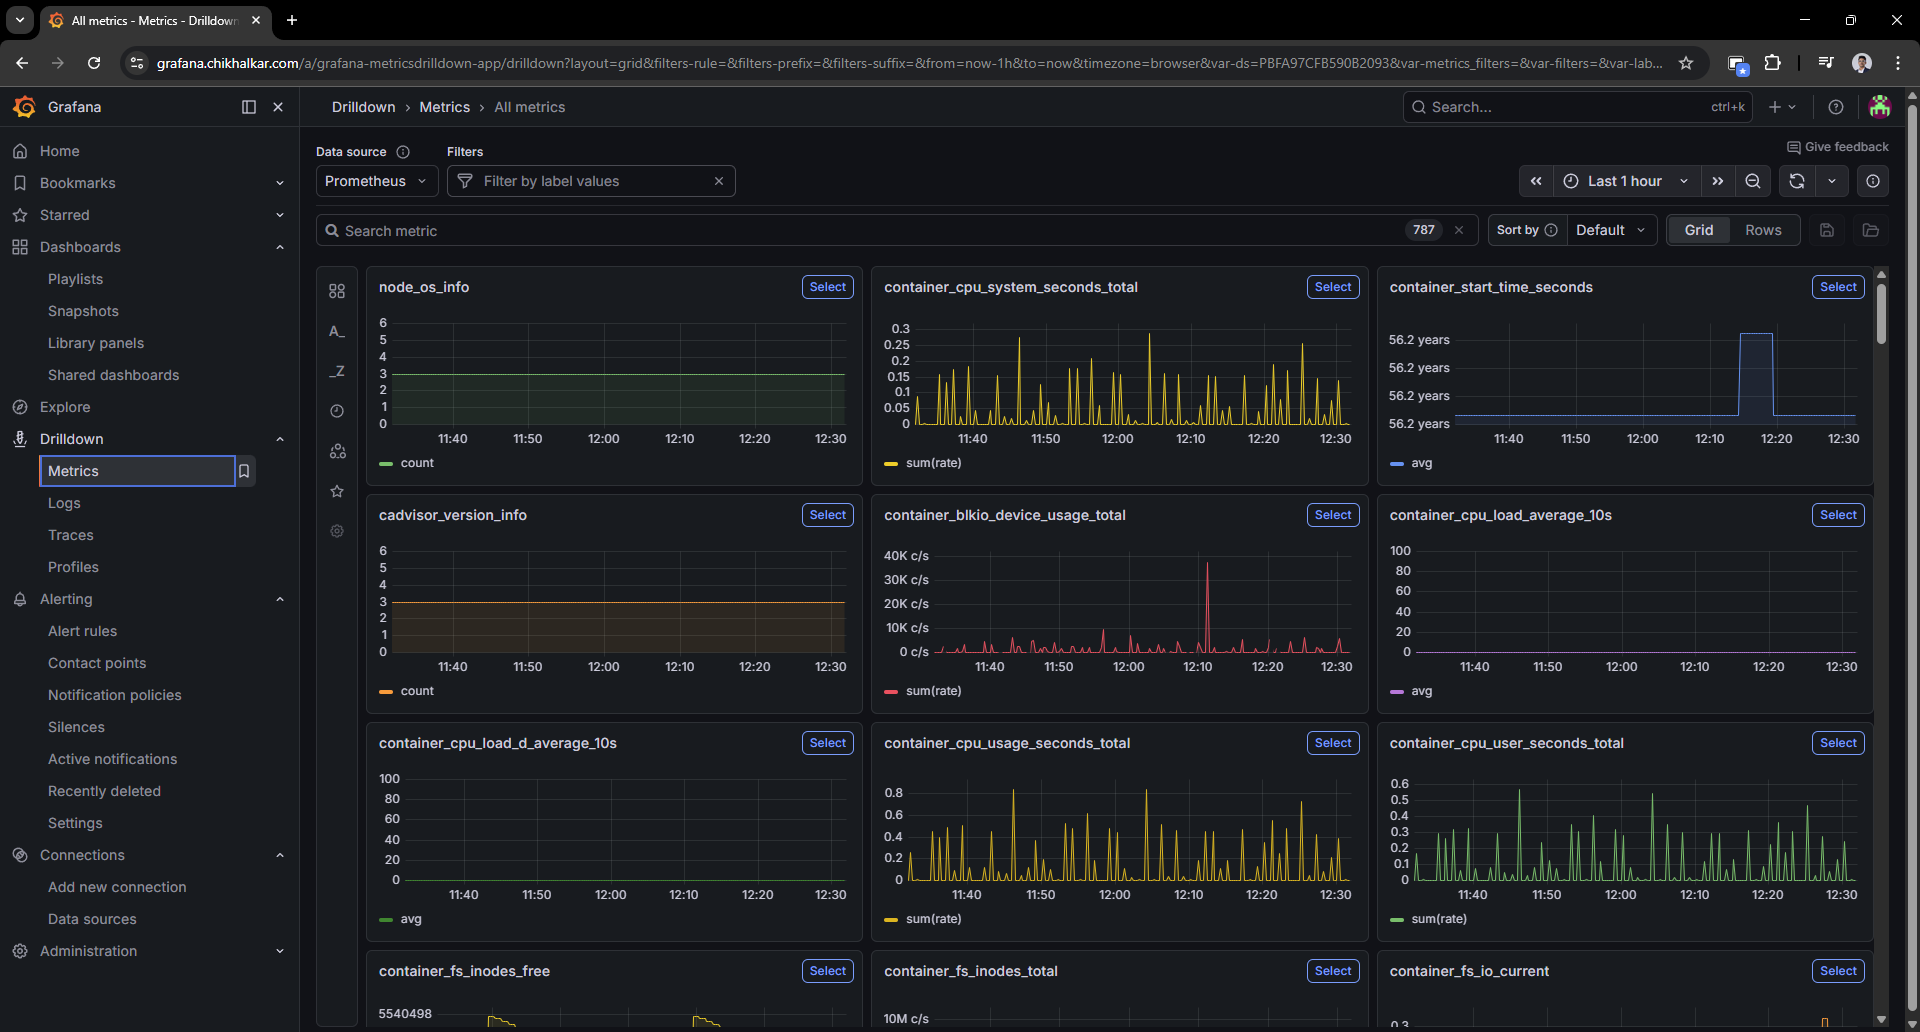 Caption: The “I wonder what’s happening right now” screen — my favorite kind of curiosity.
Traces pipeline (future-proofing)
Tempo is the “future me will thank me” part. It’s running with OTLP endpoints exposed.
I’m not tracing every service yet, but this puts me one small step away from proper request-level causality.
- instrumented apps
- OpenTelemetry collectors/agents
- trace-to-log and trace-to-metric correlation in Grafana
Deployment Notes (the practical bits)
Docker Compose organization
I keep the stack split conceptually:
- Core services (Grafana/Prometheus/Loki/Tempo/Alloy) on my monitoring host.
- Exporters (node-exporter/cAdvisor) running where the metrics live (each host), so Prometheus can scrape them.
This keeps the system scalable: adding a new machine is “install exporters + add scrape target”.
Provisioned datasources
Grafana datasources are provisioned so I’m not clicking the same three URLs every time:
- Prometheus:
http://prometheus:9090 - Loki:
http://loki:3100 - Tempo:
http://tempo:3200
The “Please Don’t Publish Your Secrets” Moment
While polishing the setup, I moved sensitive values (Grafana admin password, Proxmox token, Home Assistant token) into environment variables so:
- configs can be shared safely
- the repo doesn’t become a “free samples” table for attackers
If you’re copying this approach: treat tokens like house keys. Don’t leave them under the doormat (or in prometheus.yml).
What I Learned
- Metrics give trends: “Is it getting worse?” lives here.
- Logs give receipts: “Who did what?” lives here.
- Traces give causality: “Why was that request slow?” lives here.
- Grafana makes it approachable: otherwise it’s just three databases and a dream.
Next upgrades on the wishlist
- Alerting: “tell me before I notice” notifications (and ideally without waking the whole neighborhood).
- Tracing rollout: instrument a couple of apps with OpenTelemetry.
- Dashboard polish: more “overview” panels and fewer “scroll for 3 miles” screens.
- Label hygiene: consistent labels so cross-filtering feels magical instead of random.
Homelab rule #37: if you can graph it, you can brag about it. If you can also query the logs, you can sleep.