This page is a tutorial-style walkthrough for rebuilding my homelab observability stack: metrics (Prometheus) + logs (Loki) + traces (Tempo), all stitched together with Grafana. It’s intentionally Docker Compose-first, so you can clone/copy and get dashboards fast.
TL;DR
- Run Grafana/Prometheus/Loki/Tempo/Alloy on a “monitoring box”
- Run exporters (node-exporter + cAdvisor) on each host you care about
- Add scrape targets in Prometheus, then open Grafana and enjoy the graphs
What this includes
You end up with three pipelines that converge in Grafana:
- Metrics: Prometheus scrapes exporters + Proxmox + Home Assistant
- Logs: Alloy discovers Docker logs and pushes them to Loki
- Traces: Tempo exposes OTLP endpoints (grpc/http) for future instrumentation
Technologies used
- Grafana - Dashboards, Explore/Drilldown, correlations
- Prometheus - Metrics scraping + PromQL
- Loki - Log storage + LogQL
- Tempo - Trace storage via OTLP (grpc/http)
- Grafana Alloy - Docker log discovery + forwarding to Loki
- node-exporter - Host metrics exporter
- cAdvisor - Container metrics exporter
- Proxmox exporter - Proxmox node + guest metrics
- Home Assistant - Metrics endpoint for smart home telemetry
- Docker Compose - Repeatable deployment and upgrades
Prerequisites
- A machine (VM is fine) to run the core stack: Grafana/Prometheus/Loki/Tempo/Alloy
- One or more hosts to monitor (Linux machines running Docker)
- Optional but nice:
- Proxmox VE for virtualization metrics
- Home Assistant for smart-home telemetry
Step 1: Create your .env (keep secrets out of git)
Create monitoring/.env (or your own secrets mechanism). Example:
GF_SECURITY_ADMIN_USER=akshay
GF_SECURITY_ADMIN_PASSWORD=change-me
PVE_TOKEN_VALUE=change-me
HOMEASSISTANT_PROM_TOKEN=change-me
Step 2: Bring up the core stack (Grafana + Prometheus + Loki + Tempo + Alloy)
Here’s the “core services” Compose shape (trimmed to the parts you’ll most likely tweak):
services:
  grafana:
    image: grafana/grafana:latest
    ports: ["3000:3000"]
    environment:
      GF_SECURITY_ADMIN_USER: ${GF_SECURITY_ADMIN_USER:-akshay}
      GF_SECURITY_ADMIN_PASSWORD: ${GF_SECURITY_ADMIN_PASSWORD:?Grafana admin password not set}
    volumes:
      - ./grafana:/var/lib/grafana
      - ./grafana/provisioning:/etc/grafana/provisioning

  prometheus:
    image: prom/prometheus:latest
    ports: ["9090:9090"]
    command:
      - "--config.file=/etc/prometheus/prometheus.yml"
      - "--config.expand-env"
      - "--storage.tsdb.retention.time=30d"
      - "--web.enable-lifecycle"
    volumes:
      - ./prometheus/prometheus.yml:/etc/prometheus/prometheus.yml:ro
      - ./prometheus/data:/prometheus

  loki:
    image: grafana/loki:latest
    ports: ["3100:3100"]
    command: -config.file=/etc/loki/config.yml
    volumes:
      - ./loki/config.yml:/etc/loki/config.yml:ro
      - ./loki/data:/loki

  tempo:
    image: grafana/tempo:latest
    ports: ["3200:3200", "4317:4317", "4318:4318"]
    command: ["-config.file=/etc/tempo/config.yml"]
    volumes:
      - ./tempo/config.yml:/etc/tempo/config.yml:ro
      - ./tempo/data:/var/tempo

  alloy:
    image: grafana/alloy:latest
    ports: ["12345:12345"]
    command:
      - "run"
      - "/etc/alloy/config.alloy"
      - "--server.http.listen-addr=:12345"
    volumes:
      - ./alloy/config.alloy:/etc/alloy/config.alloy:ro
      - /var/run/docker.sock:/var/run/docker.sock:ro
Start it:
docker compose up -d
Step 3: Provision Grafana datasources (no-click setup)
Drop a datasources file like this into grafana/provisioning/datasources/datasources.yml:
apiVersion: 1
datasources:
  - name: Prometheus
    type: prometheus
    access: proxy
    url: http://prometheus:9090
    isDefault: true
  - name: Loki
    type: loki
    access: proxy
    url: http://loki:3100
  - name: Tempo
    type: tempo
    access: proxy
    url: http://tempo:3200
Step 4: Export host + container metrics (node-exporter + cAdvisor)
Run these on each host (or in a separate “exporters” compose on each machine):
services:
  node-exporter:
    image: prom/node-exporter:latest
    pid: host
    uts: host
    ports: ["9100:9100"]
    command: ["--path.rootfs=/host"]
    volumes:
      - "/:/host:ro,rslave"

  cadvisor:
    image: gcr.io/cadvisor/cadvisor:latest
    privileged: true
    ports: ["8080:8080"]
    volumes:
      - "/:/rootfs:ro"
      - "/var/run:/var/run:rw"
      - "/sys:/sys:ro"
      - "/var/lib/docker:/var/lib/docker:ro"
Step 5: Teach Prometheus where to scrape
Example scrape config (friendly host names via relabeling):
scrape_configs:
  - job_name: node
    static_configs:
      - targets: ["HOST_A:9100"]
        labels: { node_name: "host-a" }
    relabel_configs:
      - source_labels: [node_name]
        target_label: instance

  - job_name: cadvisor
    static_configs:
      - targets: ["HOST_A:8080"]
        labels: { node_name: "host-a" }
    relabel_configs:
      - source_labels: [node_name]
        target_label: instance
Home Assistant metrics (token comes from env via --config.expand-env):
  - job_name: homeassistant
    metrics_path: /api/prometheus
    authorization:
      credentials: ${HOMEASSISTANT_PROM_TOKEN}
    static_configs:
      - targets: ["HOMEASSISTANT_HOST:8123"]
Proxmox via exporter (Prometheus hits the exporter, exporter talks to Proxmox):
  - job_name: proxmox
    metrics_path: /pve
    static_configs:
      - targets: ["PROXMOX_HOST"]
        labels: { pve_name: "proxmox-node" }
    relabel_configs:
      - source_labels: [__address__]
        target_label: __param_target
      - source_labels: [pve_name]
        target_label: instance
      - target_label: __address__
        replacement: pve-exporter:9221
Reload Prometheus after edits:
curl -X POST http://localhost:9090/-/reload
Step 6: Ship Docker logs into Loki with Alloy
Grafana Alloy is the log collection agent in this setup. It discovers Docker containers through the Docker socket, enriches log streams with stable labels (useful for filtering in Grafana), and forwards them to Loki.
This Alloy config discovers containers, adds a few helpful labels, and forwards logs to Loki:
discovery.docker "local" {
  host = "unix:///var/run/docker.sock"
}

discovery.relabel "docker_logs" {
  targets = discovery.docker.local.targets

  rule {
    source_labels = ["__meta_docker_container_name"]
    target_label  = "container"
  }

  rule {
    source_labels = ["__meta_docker_container_log_stream"]
    target_label  = "stream"
  }

  rule {
    source_labels = ["__meta_docker_container_label_com_docker_compose_service"]
    target_label  = "compose_service"
  }
}

loki.source.docker "local" {
  host       = "unix:///var/run/docker.sock"
  targets    = discovery.relabel.docker_logs.output
  forward_to = [loki.write.local.receiver]
}

loki.write "local" {
  endpoint {
    url = "http://loki:3100/loki/api/v1/push"
  }
}
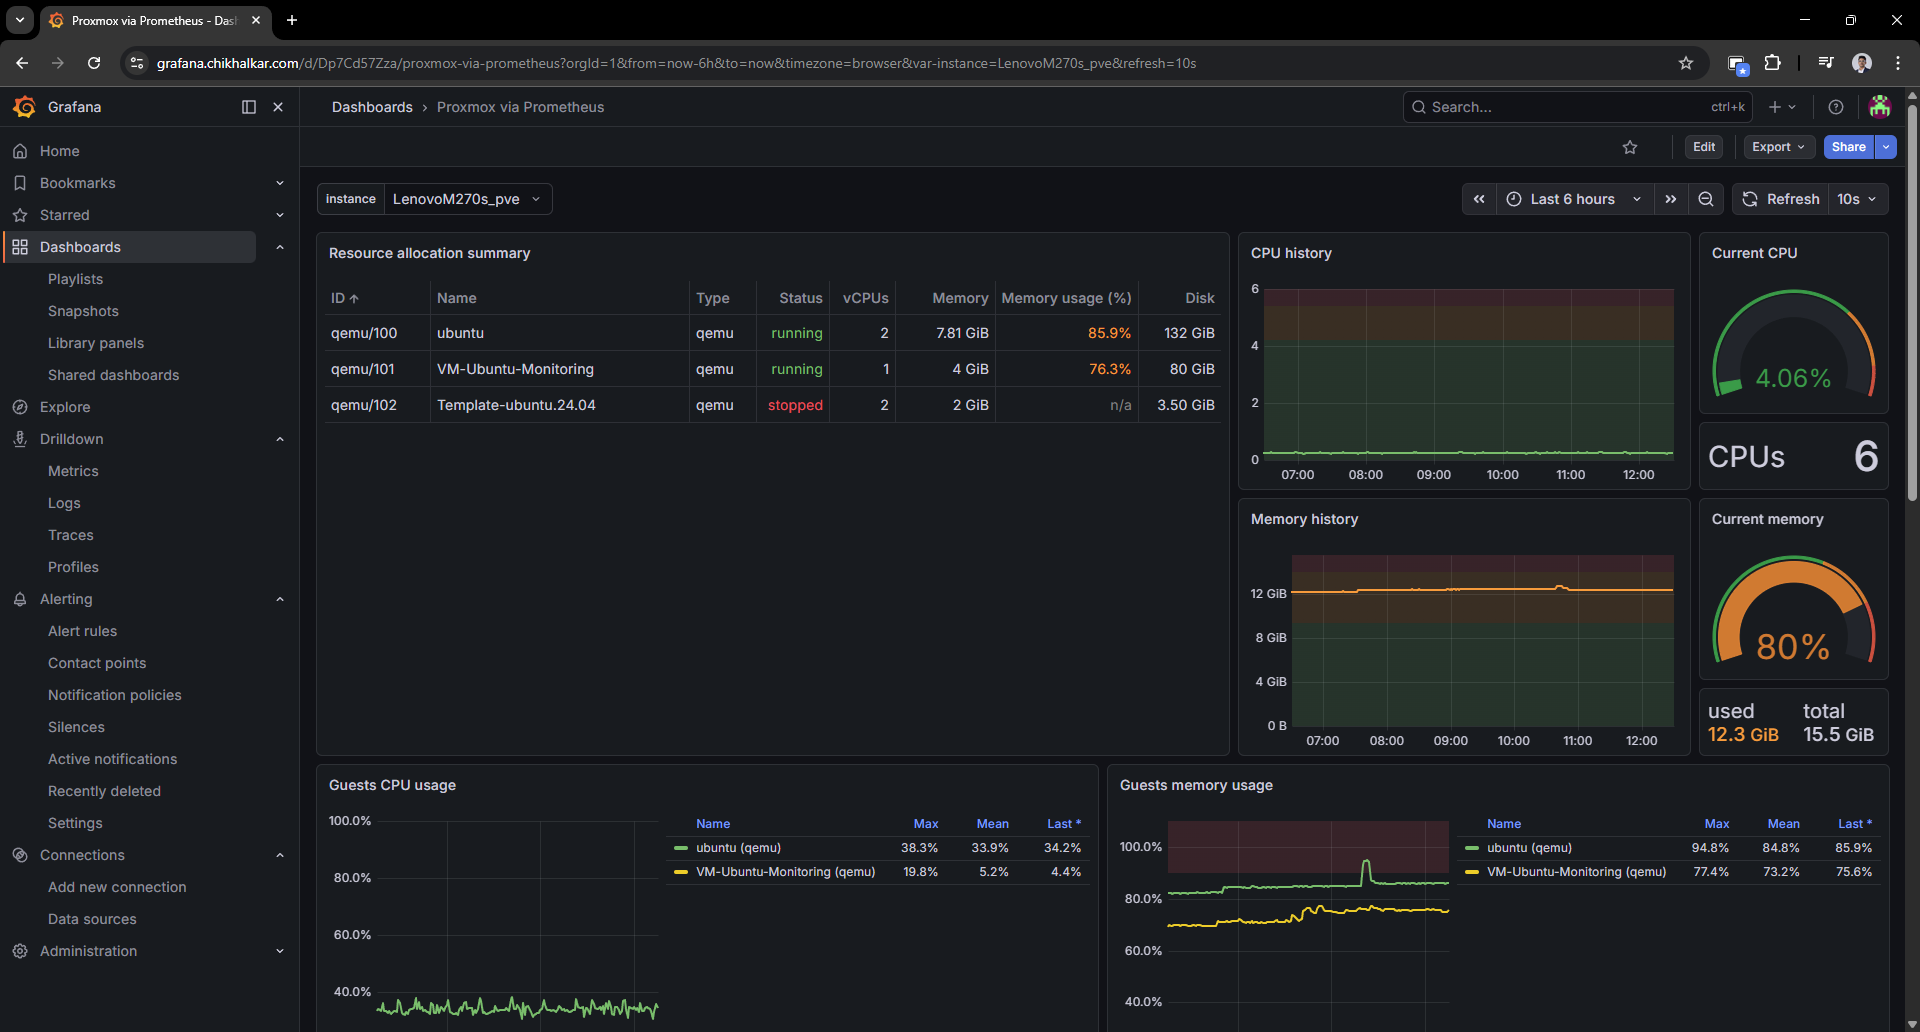
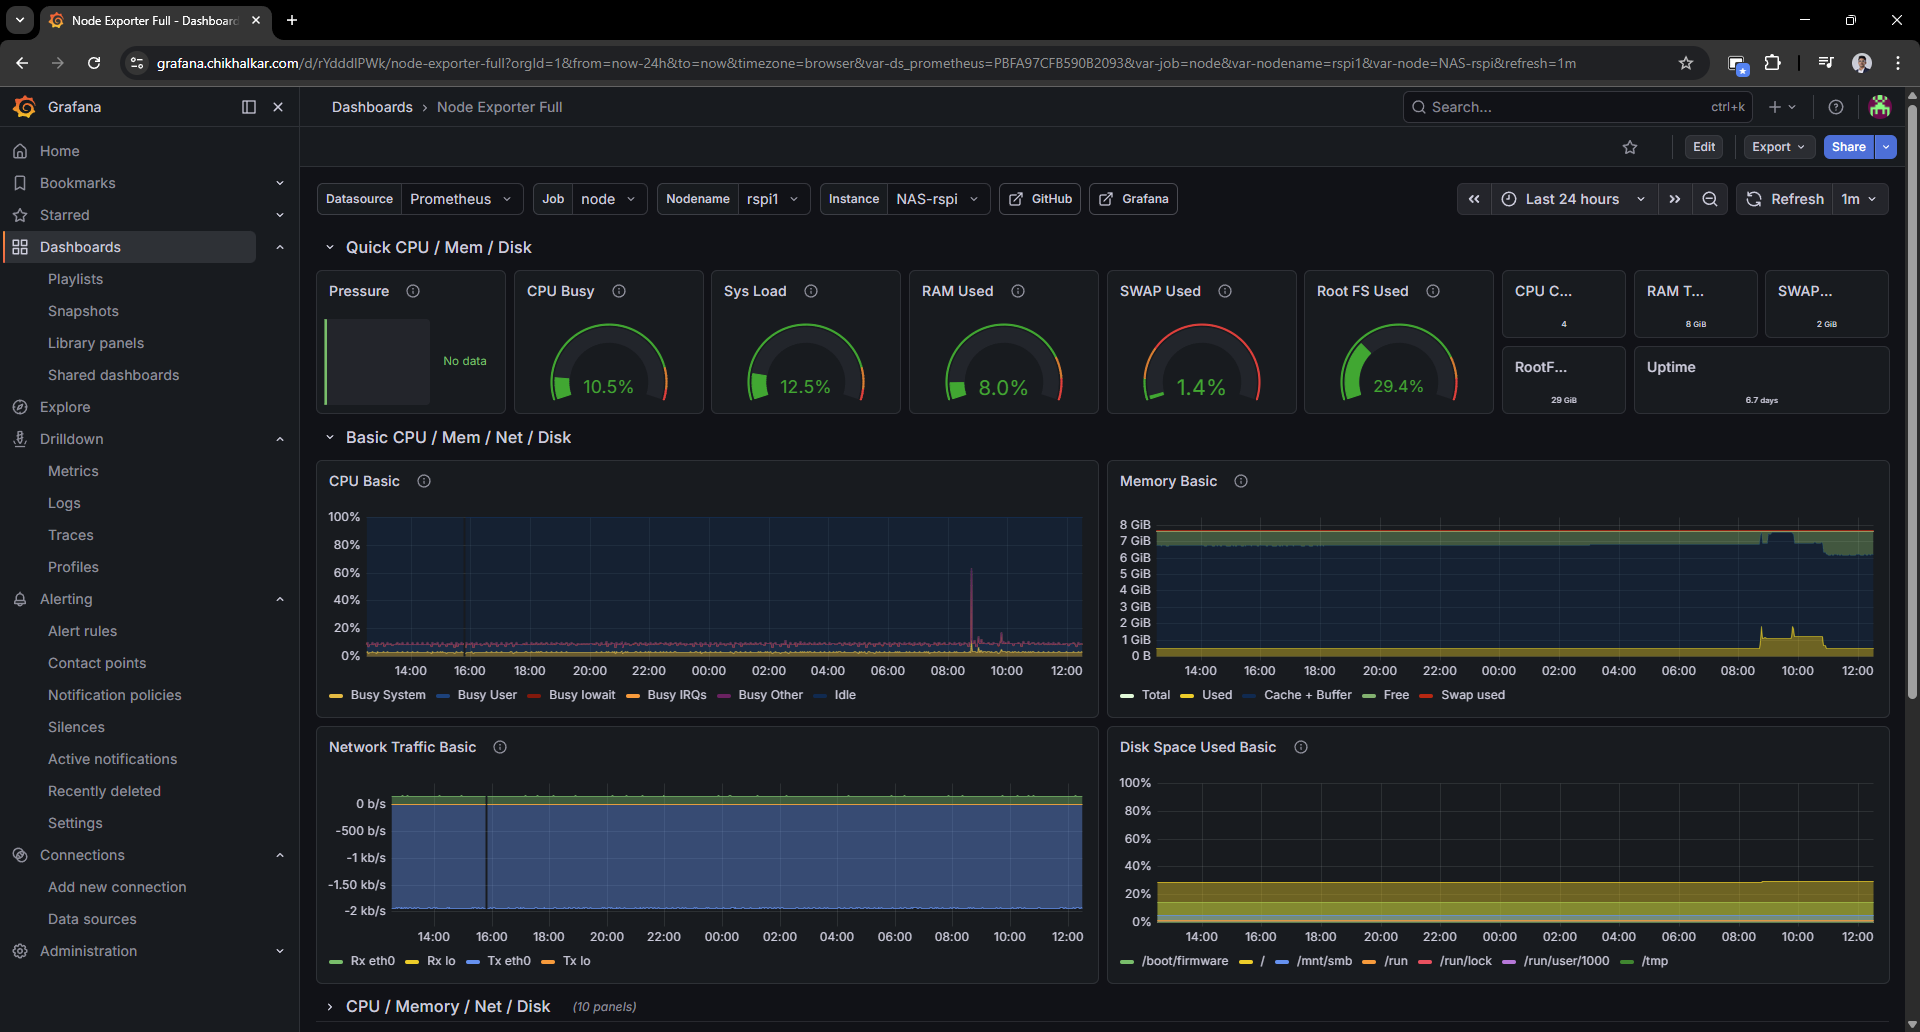
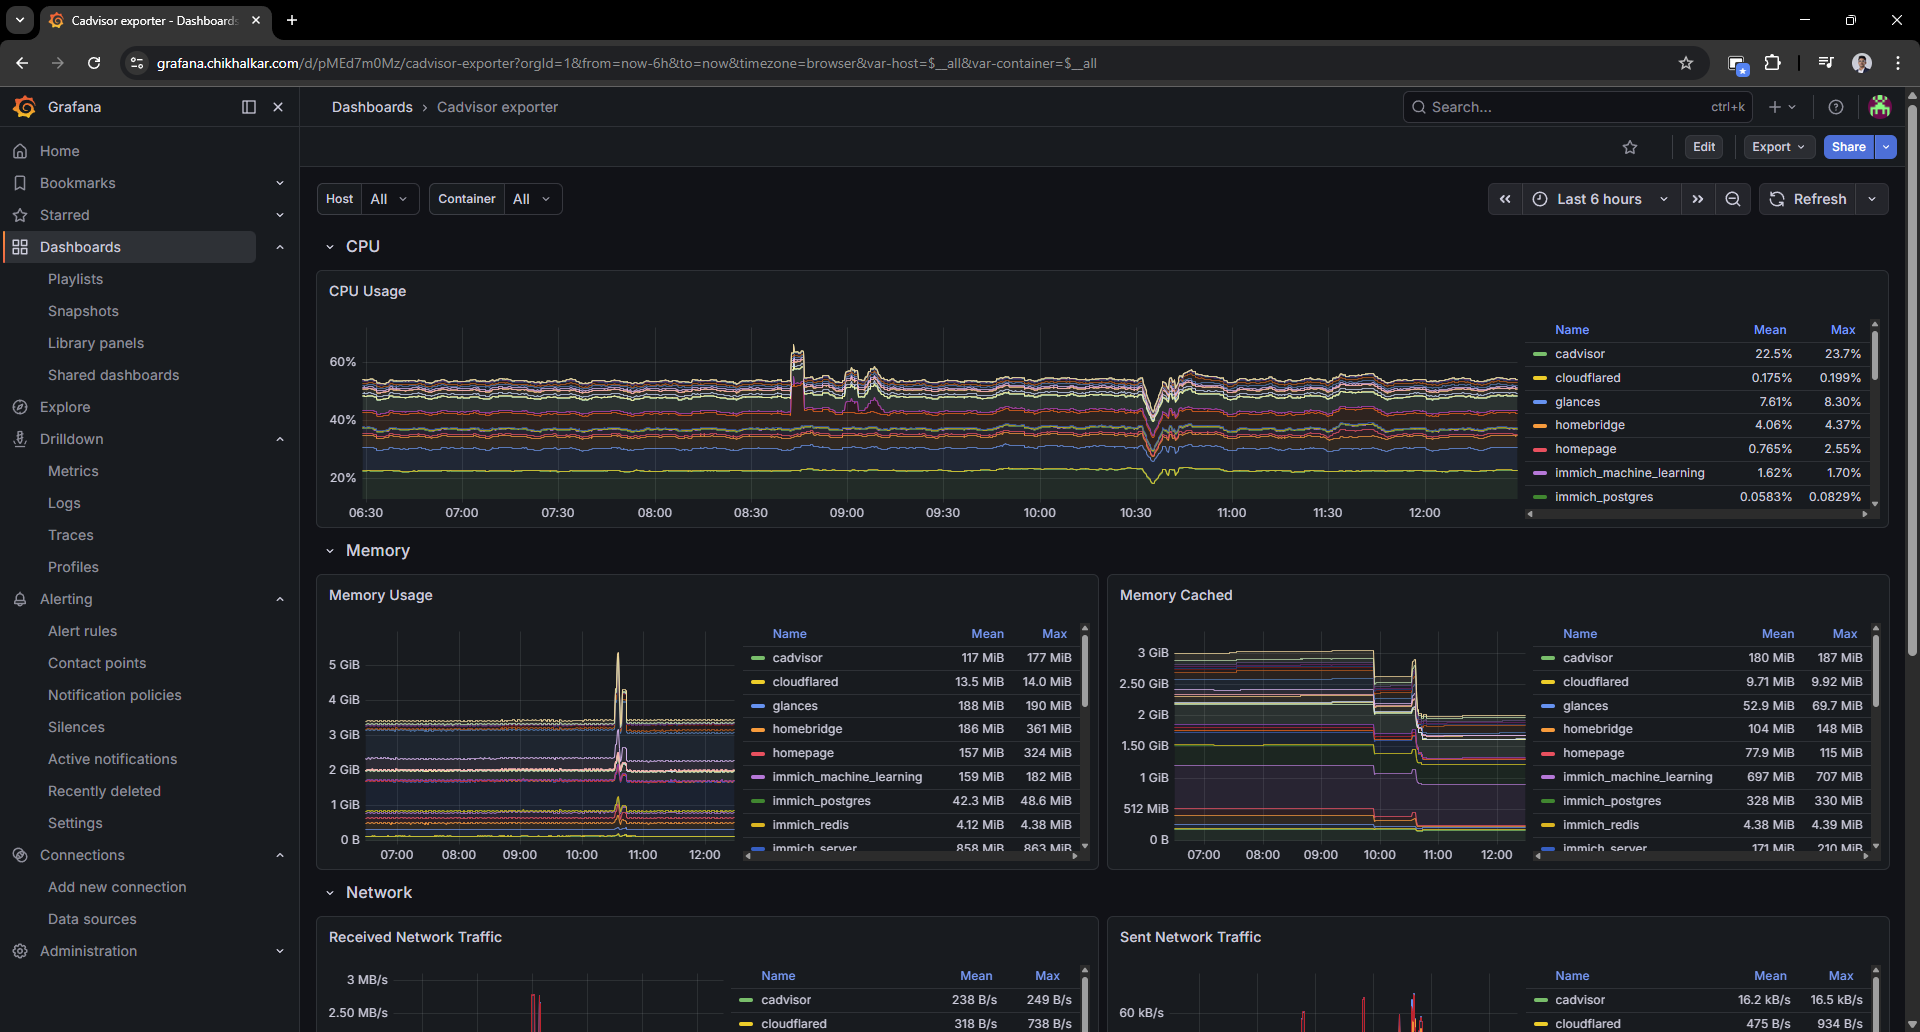
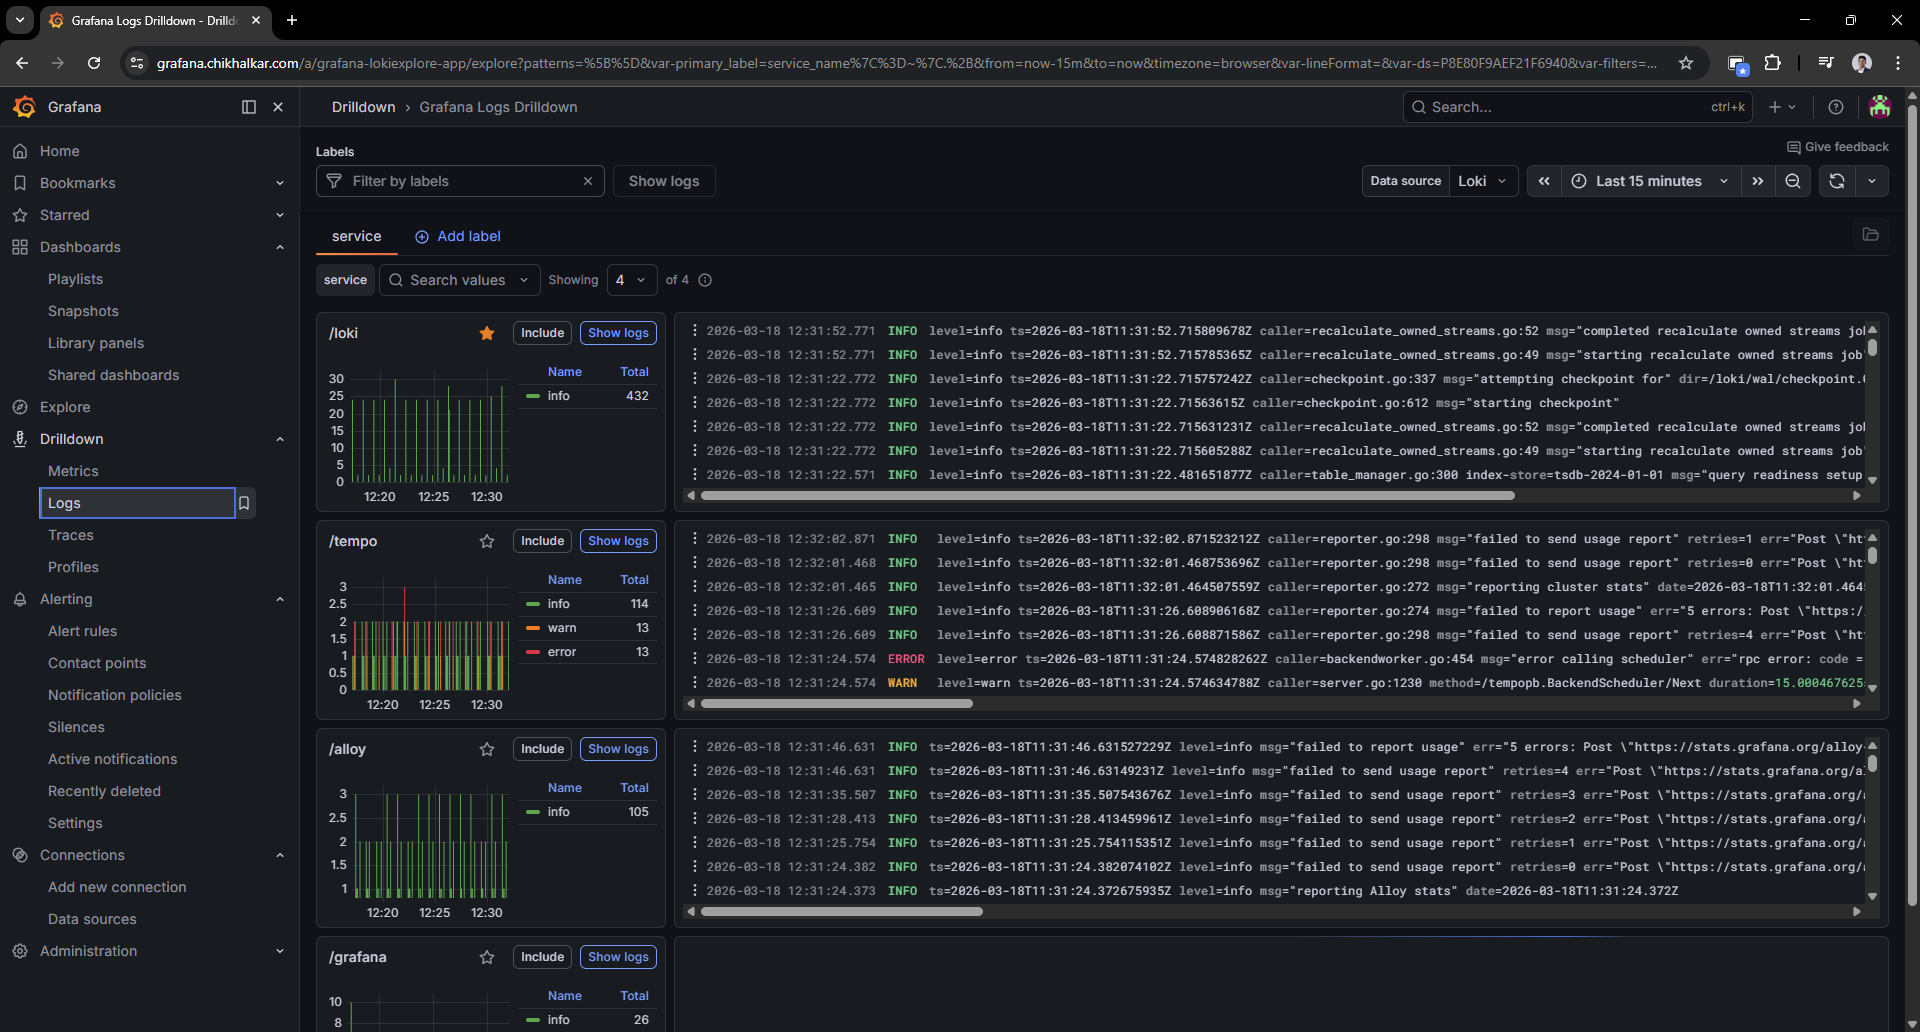
Step 7: Validate in Grafana
Proxmox dashboard
Host dashboard (node-exporter)
Container dashboard (cAdvisor)
Logs drilldown (Loki)
Challenges
- Multi-host reality: exporters live on multiple machines, so naming/labels must be consistent.
- Signal overload: it’s easy to collect everything and understand nothing. Dashboards need restraint.
- Secrets management: tokens/passwords belong in environment variables, not in configs or posts.
Key takeaways
- Why metrics, logs, and traces each answer different questions.
- How labeling strategy directly affects usability in Grafana.
- How to keep an observability stack “small enough to run at home” without feeling toy-like.
Future enhancements
- Alerting (Grafana-managed alerts) for proactive notifications
- OpenTelemetry instrumentation for a couple of key services
- Dashboard consolidation into a fast “daily driver” overview
- Retention tuning based on actual homelab usage patterns